

Key Points
- In our view, normalization in the macroeconomic environment should lead to normalization in relative performance between growth and value stocks.
- Even in periods of multiple contraction for expensive stocks, multiples for cheap stocks have remained relatively flat, suggesting a certain degree of downside protection.
- Allocating to value could offer investors diversification and help minimize the impact of a market drawdown while also participating in the market’s upside.
When should I start to buy value stocks? As value investors, this is one of the most frequently asked questions we have received thus far in 2024, and our reply has remained consistent—always.
Earlier this year, the question was usually raised in the context of the robust market leadership of large-cap growth stocks, which saw share prices and valuations pushed to levels reminiscent of the late 1990s tech bubble. More recently, since the start of the third quarter, markets saw an abrupt reversal in the relative performance of growth versus value, akin to 2022, when the Russell 1000® Value index substantially outpaced the S&P 500® and Russell 1000® Growth indices.
Money in Motion
For a more constructive response to the question above, we would need to identify catalysts that could unseat growth and shift market leadership. A question to consider might be, “What prompts money in motion?” Historically, this has been achieved through macroeconomic data and monetary policy, major geopolitical events, a global financial crisis and a global pandemic, among other phenomena.
Everyday financial metrics such as company valuations rarely effect market-leadership changes. In our view, valuation is a poor market-timing tool—expensive stocks can stay expensive, or get more expensive, and cheap stocks can stay cheap, or get cheaper. In a ‘Goldilocks’ environment, valuations tend to take a back seat to exuberance and matter less, until they matter more.
Hindsight Is 20/20
In our experience, one of the most effective ways to spot a market turn is through hindsight. For this reason, we believe that rebalancing is imperative and that allocating to value stocks is practical in all market environments. As you may have already gathered, we are not proponents of market timing. We are quick to acknowledge that we do not have an edge on the macroeconomic environment or on the types of catalysts mentioned above.
We focus more on microeconomic factors, including fundamental company research, to inform the macroeconomic views that flow into our investment and portfolio-construction decision-making. We embrace skepticism and concentrate on durable change on the margin. For instance, if a company tells us that its costs have been incrementally rising, and we discover that its peers are echoing a similar sentiment, we can infer that costs are climbing for a broader swatch of companies and consumers. This approach gives us a direct read into inflation trends occurring throughout the broader economy. While perhaps backward looking, we believe these direct observations can serve as better indicators than the retroactive, key economic data preferred by the Federal Reserve (Fed). Fed Chair Jerome Powell’s “transitory” inflation remarks back in 2021, which did not pan out as expected, are a case in point.
In our experience, one of the most effective ways to spot a market turn is through hindsight. For this reason, we believe that rebalancing is imperative and that allocating to value stocks is practical in all market environments.
If our team lacks an edge, or the will to time the market, then why do we believe that the time is always right to buy value? In our view, the following reasons support our case.
1. We believe that normalization in the macroeconomic environment should lead to normalization in stock-market performance.
First, we believe that mean reversion theory, also known as reversion to the mean, should play out as the macroeconomic environment normalizes. Over the last 90 years, value has outperformed growth on a rolling 10-year basis by roughly 400 basis points, as depicted by the dotted orange line in the chart below. Within this time frame, we have seen multiple market cycles, recessions, soft patches, booming economies, bull markets, bear markets, etc., arise. Notably, in the last 15 years, growth materially outpaced value. In our view, the robust performance of growth stocks over that period was largely driven by extremely accommodative monetary policy and quantitative easing—in other words, free money—put in place following the global financial crisis to stabilize the financial system and the global economy.
As the macroeconomic environment has begun to normalize to pre-global financial crisis levels, monetary policy has become more restrictive and quantitative easing has been replaced with quantitative tightening. Namely, the era of free money has come to an end. We believe this development could be a catalyst that brings the relative performance of value versus growth closer to historical averages, though this may take some time to materialize.
Relative Return of Value to Growth
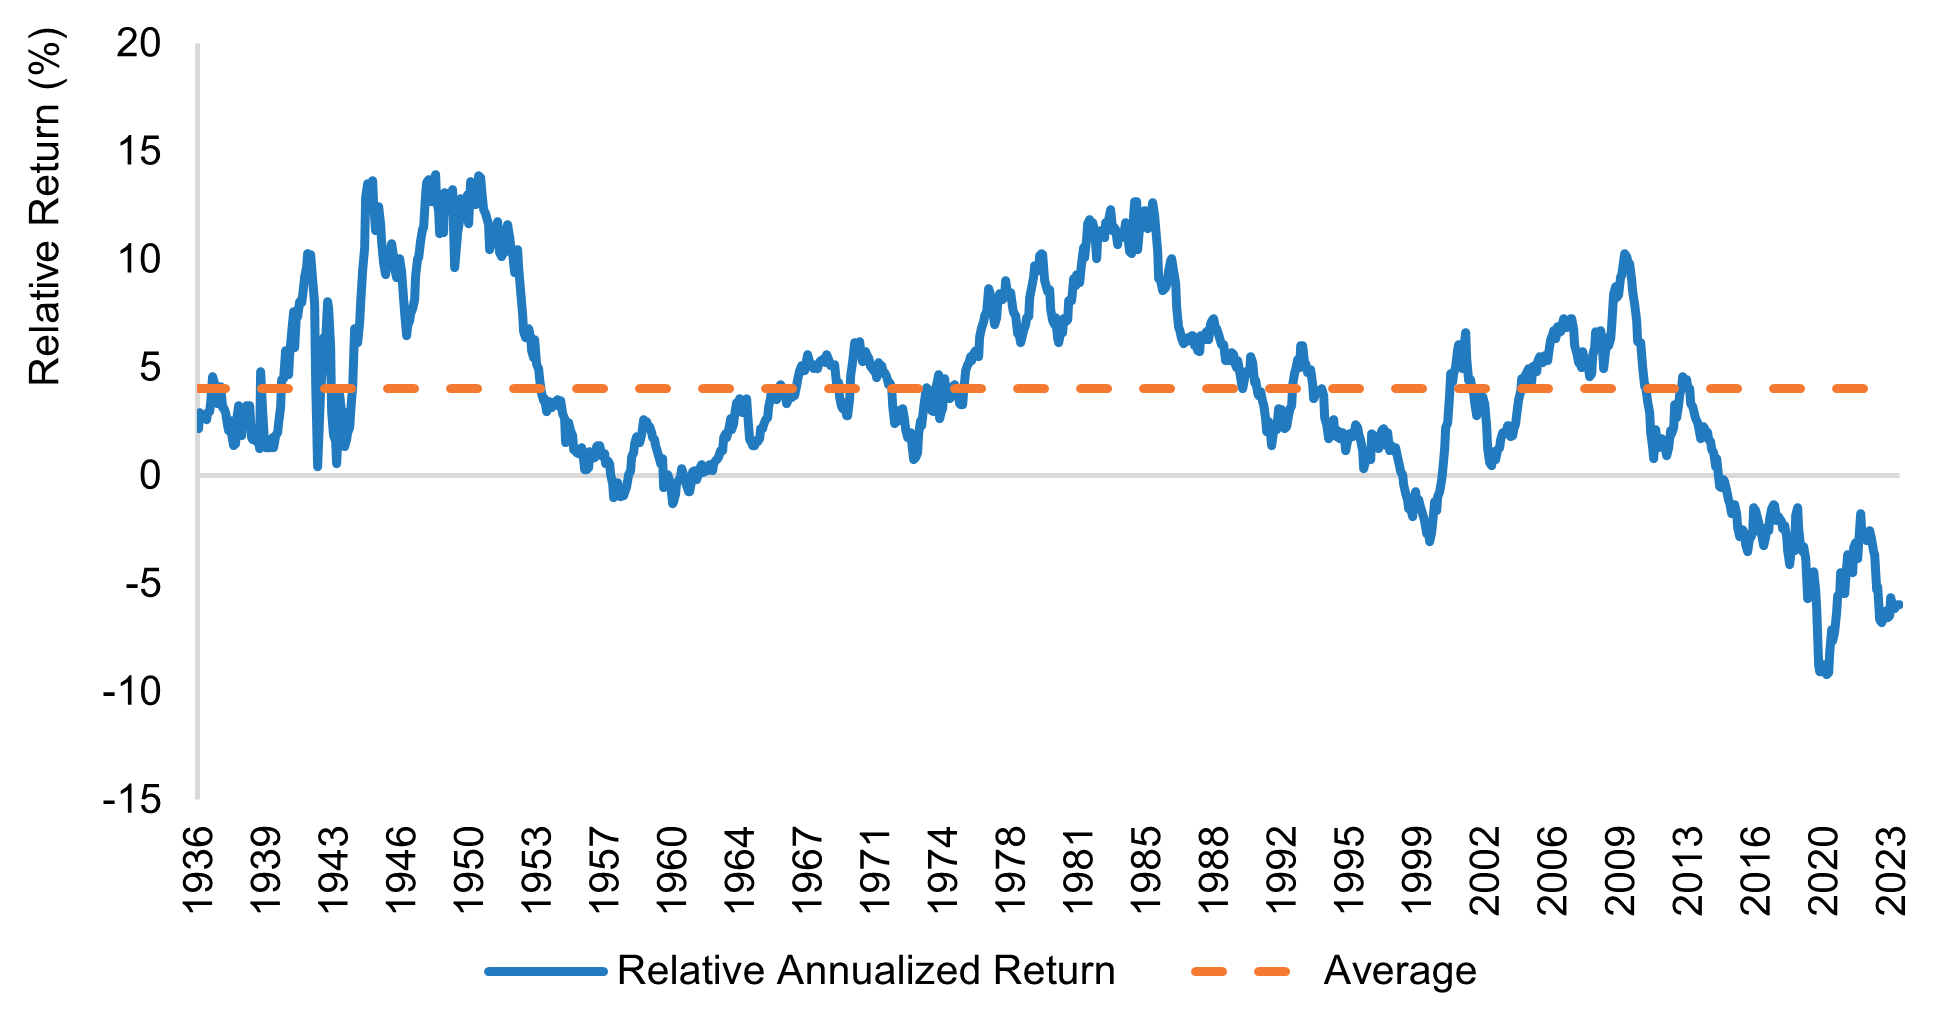
For illustrative purposes only. Source: Newton Investment Management and Alliance Bernstein, as of May 31, 2024. Blue line represents Value/Growth 10-Year Rolling Relative Return. This is a “relative” chart of Growth and Value; the indices used are proprietary to Alliance Bernstein. Value is defined as the lowest quintile of price-to-book (P/B) ratio, while Growth is defined as the highest quintile of P/B ratio.
We do not expect value to outperform growth at levels seen in 2009, the mid 1980s, or the late 1940s and early 1950s. However, we do believe that as the macroeconomic environment normalizes, so should relative performance.
2. “Expensive” stock prices are getting more expensive.
Another reason we believe investors should allocate to value is because value stocks can bring balance to a portfolio. Value stocks are relatively less expensive than growth stocks, with lower price-to-earnings (P/E) ratios; yet they are still solid investments. A P/E ratio can be a useful barometer for determining what factors the market is pricing into a company’s stock price from an earnings-power perspective. Value stocks are often considered cheap, while growth stocks are typically pricier, as investors tend to bid up prices of growth stocks to get ahead of their greater earnings-growth prospects.
The chart below shows the gap between the most expensive and least expensive quintiles of stocks in the S&P 500®, as measured by their P/E ratios. As the chart illustrates, there have been periods in time when expensive stocks have become more expensive relative to both cheap stocks and their own history. For instance, expensive stocks have recently begun to approach highs akin to the 1990s dot-com bubble, largely driven by investor exuberance around the ‘magnificent seven’ group of large-cap growth tech stocks and the disruptive potential of artificial intelligence. However, it is important to note that when expensive stocks have skyrocketed historically, they often later experienced multiple contractions (i.e., lower P/E levels), as waning enthusiasm caused share prices to retreat.
Expensive Stocks Are Looking Expensive
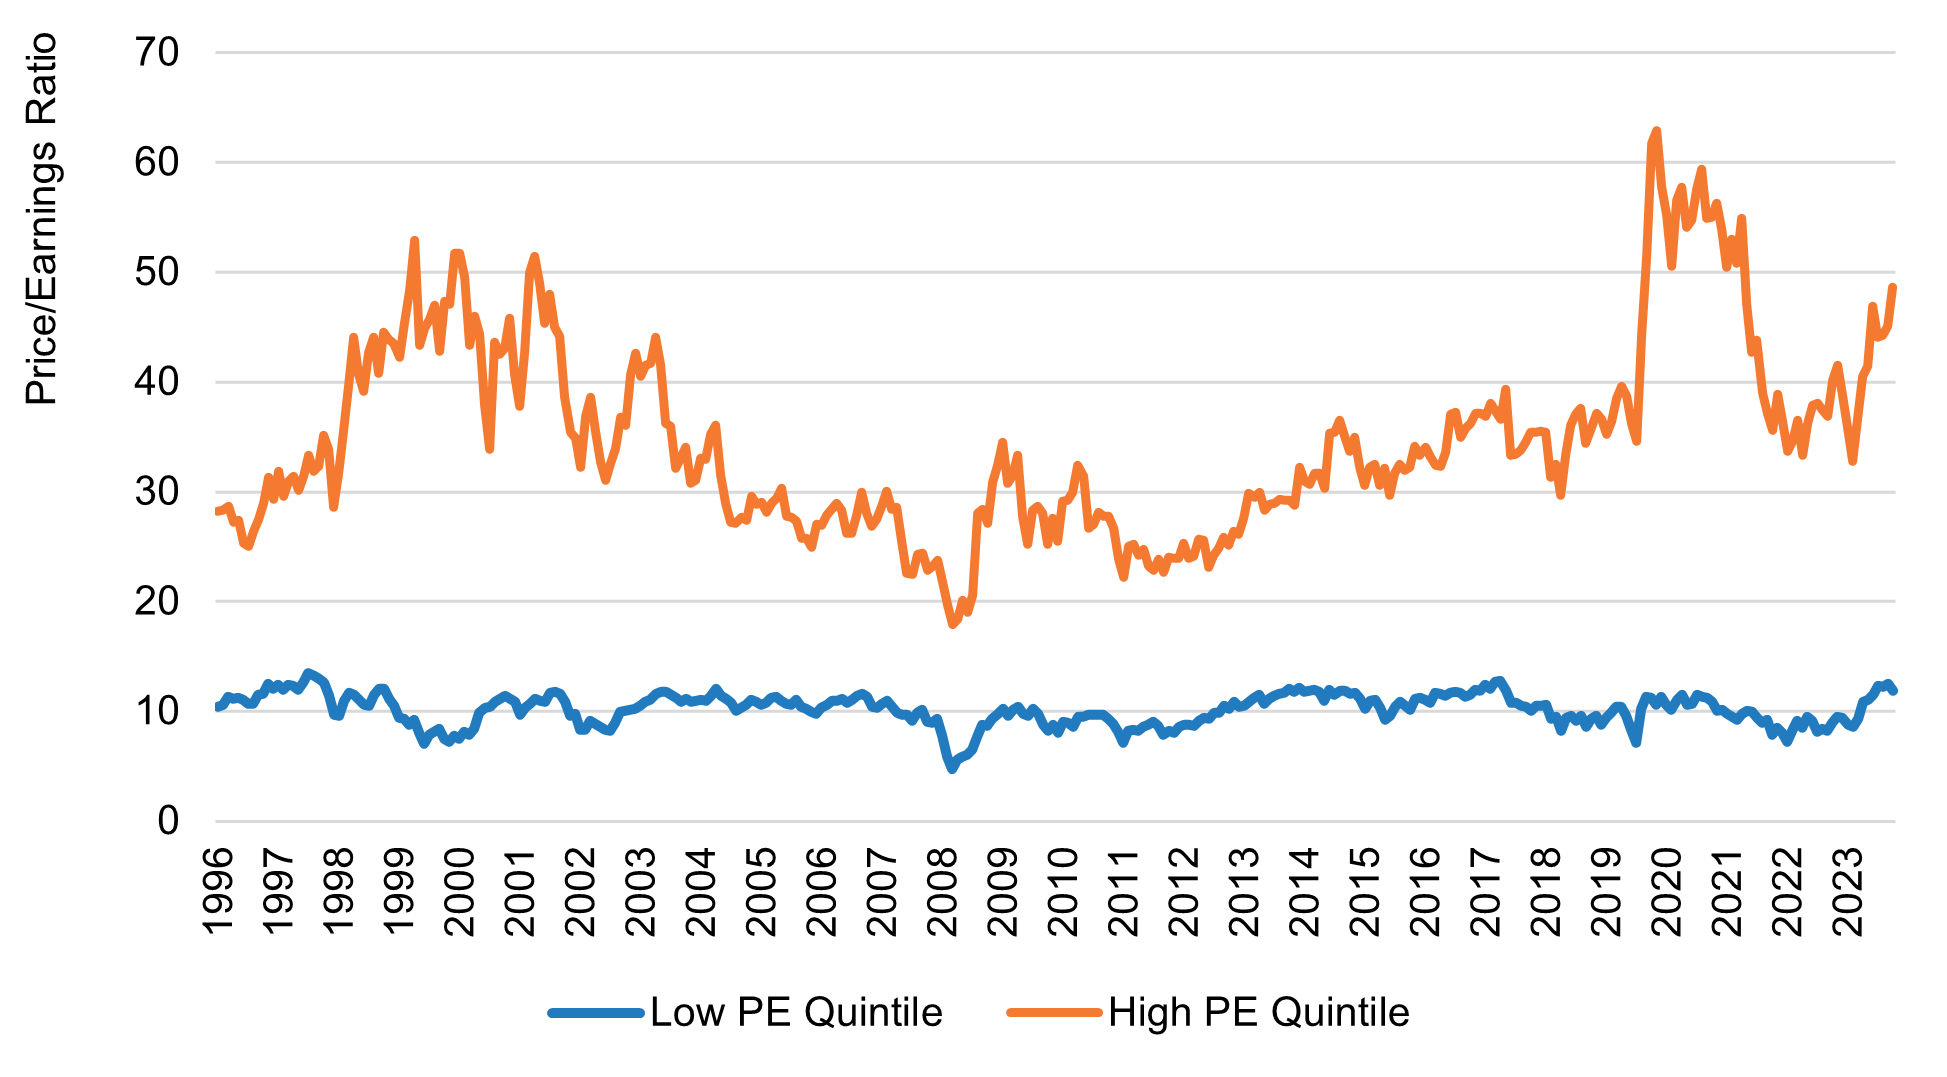
Source: Newton Investment Management, FactSet, as of June 30, 2024.
The remarkable consistency of cheap stocks over the same period is also noteworthy. While cheap stocks look cheap relative to pricier stocks, they also continue to look cheap relative to their own history. Even in periods of multiple contraction for expensive stocks, multiples for cheap stocks have remained relatively flat, suggesting a certain degree of downside protection.
3. Growth and value investing is not a zero-sum game.
We also believe that allocating to value makes sense due to the changing dynamics of the risk-reward ratio between growth and value since the Covid-19 pandemic. In the ten years leading up to the pandemic, growth was the clear market leader, as accommodative monetary policy and the Fed put gave investors the confidence to ‘buy the dip’ during periods of market volatility. As the table below shows, growth delivered an impressive 15.2% annualized return while experiencing relatively mild average drawdowns of 7.6%. Based on our conversations with investors and clients, the consensus view was that value performance during this time was flat at best and negative at worst. Yet, over the same period, value delivered an annualized return of 11.8%, a respectable absolute return in our view. However, we do understand the sentiment, as value lagged growth by over 300 basis points on a relative basis.
Since the pandemic, and the shift in both the macroeconomic environment and monetary policy, value has closed the gap. While growth has still outperformed, the margin has been cut in half. More notable, perhaps, are the drawdown statistics; over this period, the average drawdown for value is nearly 400 basis points less than that of growth. Circling back to our previous remarks on the multiple-contraction potential of expensive growth stocks, we see that allocating to value could offer investors some diversification and help minimize the impact of a market drawdown on a portfolio while still participating in the market’s upside.

Source: Newton Investment Management and Morningstar, as of August 31, 2024.
A Balanced Approach
Since the beginning of this year, we have advocated for taking a balanced approach to investing. This was predicated on the rising uncertainty around several macroeconomic factors including economic growth, inflation and monetary policy, all of which could bring heightened volatility to markets and investor returns. We believe the same logic applies when constructing holistic investment portfolios, favoring a reasonable balance between growth and value stocks, particularly against the current backdrop of rising valuations and concentration risk among growth indices and benchmarks.
Identifying Idiosyncratic Opportunities
From a value-investing perspective, we refer to “balance” as accounting for and neutralizing macroeconomic risk, while relying on our investment process to identify compelling idiosyncratic opportunities. We continue to lean on our strengths and strive to be good stock pickers, while minimizing unintended and uncompensated risks.
Pulling back from the immediate term, we continue to believe that companies and investors alike are adjusting to the normalization of both inflation and interest rates in the US, not to pre-Covid levels but to pre-global financial crisis levels. In our view, inflation is likely to be higher and more persistent than it was in the 12 years leading up to the pandemic, and as a result, the Fed may keep interest rates elevated. While inflation has moderated from peak levels and is headed in the right direction, and while monetary policy is likely to follow, we firmly believe that the days of benign inflation and free money are behind us. In the future, we believe that fundamentals, valuations, and the ability to generate in-house liquidity via solid free cash flow should play a larger role in separating the winners from the losers. As always, we favor companies sitting at the nexus of strong and improving fundamentals, attractive valuations and catalyst-driven business momentum.
Authors

Chris Hazelton
Global investment strategist

Newton US large cap value & income team
Insights from the Newton US large cap value & income team
PAST PERFORMANCE IS NOT NECESSARILY INDICATIVE OF FUTURE RESULTS. Any reference to a specific security, country or sector should not be construed as a recommendation to buy or sell this security, country or sector. Please note that strategy holdings and positioning are subject to change without notice. MAR006646 Exp 09/29. For additional Important Information, click on the link below.
Important information
For Institutional Clients Only. Issued by Newton Investment Management North America LLC ("NIMNA" or the "Firm"). NIMNA is a registered investment adviser with the US Securities and Exchange Commission ("SEC") and subsidiary of The Bank of New York Mellon Corporation ("BNY"). The Firm was established in 2021, comprised of equity and multi-asset teams from an affiliate, Mellon Investments Corporation. The Firm is part of the group of affiliated companies that individually or collectively provide investment advisory services under the brand "Newton" or "Newton Investment Management". Newton currently includes NIMNA and Newton Investment Management Ltd ("NIM") and Newton Investment Management Japan Limited ("NIMJ").
Material in this publication is for general information only. The opinions expressed in this document are those of Newton and should not be construed as investment advice or recommendations for any purchase or sale of any specific security or commodity. Certain information contained herein is based on outside sources believed to be reliable, but its accuracy is not guaranteed.
Statements are current as of the date of the material only. Any forward-looking statements speak only as of the date they are made, and are subject to numerous assumptions, risks, and uncertainties, which change over time. Actual results could differ materially from those anticipated in forward-looking statements. No investment strategy or risk management technique can guarantee returns or eliminate risk in any market environment and past performance is no indication of future performance.
Information about the indices shown here is provided to allow for comparison of the performance of the strategy to that of certain well-known and widely recognized indices. There is no representation that such index is an appropriate benchmark for such comparison.
This material (or any portion thereof) may not be copied or distributed without Newton’s prior written approval.
In Canada, NIMNA is availing itself of the International Adviser Exemption (IAE) in the following Provinces: Alberta, British Columbia, Manitoba and Ontario and the foreign commodity trading advisor exemption in Ontario. The IAE is in compliance with National Instrument 31-103, Registration Requirements, Exemptions and Ongoing Registrant Obligations.


