

Key Points
- We believe relative-value strategies are well placed to exploit the current conditions of greater dispersion and heightened volatility.
- US earnings continue to grow but the gap between valuation and earnings has increased.
- There is still room for the US economy to expand, if the new Trump administration can quickly implement its growth initiatives, or contract if it enacts policies that impede growth.
Relative Value versus Directional Alpha
The discount rate is one of the most important metrics in the evaluation of financial assets. Current short-term interest rates are a proxy for the discount rate that is used to determine the net present value of all the future cash flows associated with a financial asset.
The change in cash rates and the discount rate, which began in the aftermath of the Covid pandemic when policy rates began to move higher, signaled the transition from a directional market regime to a relative-value market regime. In our view, this has significant consequences for investors. For example, in a directional regime when the market is in an upward or downward trend, buy and hold equity strategies have typically thrived. On the other hand, a relative-value environment may require a more tactical view across an investment universe that also includes a fair amount of dispersion.
We expect 2025 to continue to favor relative-value alpha strategies that seek to generate a return that is uncorrelated with the broader market, while buy-and-hold directional strategies are likely to face challenges and relatively low premiums. Strategies that utilize relative value have shown increased effectiveness due to dispersion across monetary and policy rates, fiscal tightening, growth rates, inflation rates and returns—not only in equities and bonds but also across currencies and commodities.
Key takeaway: Embrace the macro dislocations and uncertainty as opportunities to generate alpha.
US Inflation
Due to the large Covid-era stimulus, the US experienced unprecedented inflation, which peaked at 9%. Conveniently, the Federal Open Market Committee (FOMC) redefined its inflation target as Flexible Average Inflation Targeting (FAIT), where an average of 2% could be commensurate with a current level of 2.5% (core personal consumption expenditures inflation). Unfortunately for the FOMC and the new US administration, historically it has been the rule, rather than the exception, that inflation jumps or reaccelerates before it settles at levels closer to 2.5%.
We believe there could be a slight increase in the US consumer price index (CPI) to 2.6% relative to the consensus forecast of 2.4% over the next 12 months. More worryingly, the Cleveland Federal Reserve’s nowcasting model forecasts the December 2024 CPI to be 0.38%, equivalent to 4.5% on an annualized basis.1 Its year-over-year inflation forecasts are all around 3%.
Forecasted 12-month Change in US Headline CPI
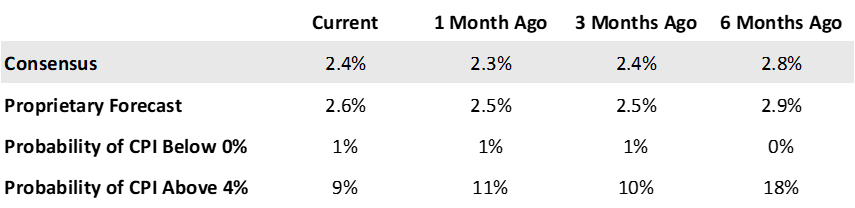
Key takeaway: Do not ignore risk of inflation running hot before it settles at 2%.
Currencies: US Dollar and Japanese Yen
The value of the US dollar as represented by the US Dollar Index has rallied 9.5% since October 2024. This has quickly become one of the more crowded trades as both systematic and discretionary strategies latch onto this clear trend. However, a strong, or in this case over-valued, US dollar relative to the Japanese yen and Chinese renminbi does not suit the long-term policy goals of the new US Trump administration. To facilitate ‘friend shoring’ and improved competitiveness for US manufacturers, the dollar needs to move in the other direction.
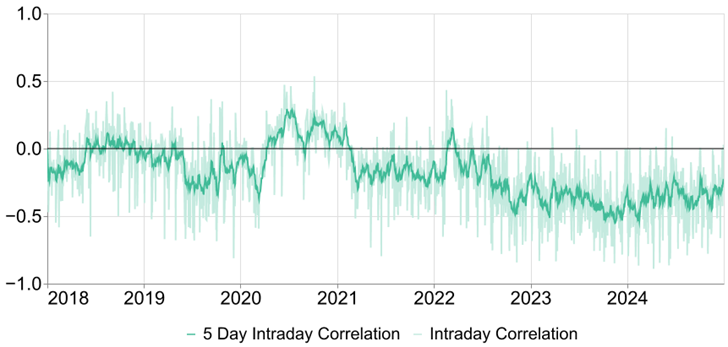
In the meantime, the dollar provides a useful and rare negative correlation to bonds and equities. We believe other currencies such as the yen could balance this trend, perhaps making it the anti-fragile currency for 2025.
US 10-year Treasury note vs. US Dollar Index
S&P 500 vs. US Dollar Index
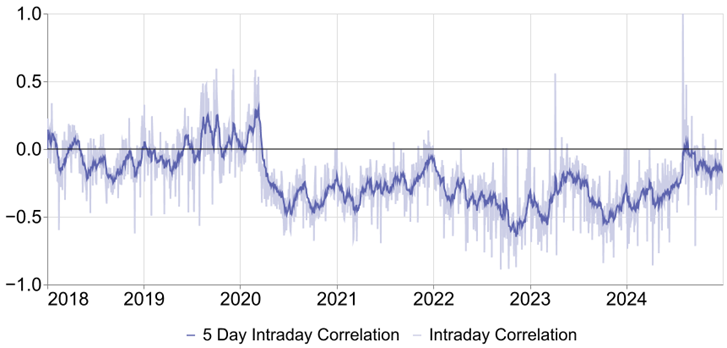
Key takeaway: Enjoy the US dollar ride while it lasts; look for other currencies such as the Japanese yen to balance exposure.
US Equity Earnings
Thus far, US equity earnings in 2024 have not disappointed, with full-year earnings-per-share (EPS) growth expected to be 11.7%, the highest since the post-Covid recovery in 2021. We expect S&P 500® EPS to fall short of expectations yet still provide healthy growth with little chance of a contraction. Over the next 12 months, the S&P 500 EPS consensus forecast is 12.1%, while our proprietary forecast is 6.6%, or approximately one half that of the consensus. Fundamental analysts tend to be an optimistic bunch who start the calendar year with high expectations but then walk back their outlook as each quarter’s earnings become clearer.
Despite positive EPS growth, the value of the S&P 500 has run ahead of the bottom-up earnings since 2023.2 This is the same period when EPS grew a meager 2% in nominal terms against the total return of 26.3% and inflation of 6.5%. In fact, the gap between valuation and earnings has increased due to the boost related to artificial intelligence (AI), a productivity tool which is as yet difficult to quantify.
S&P 500: Change in Forward 12-Month EPS vs. Change in Price
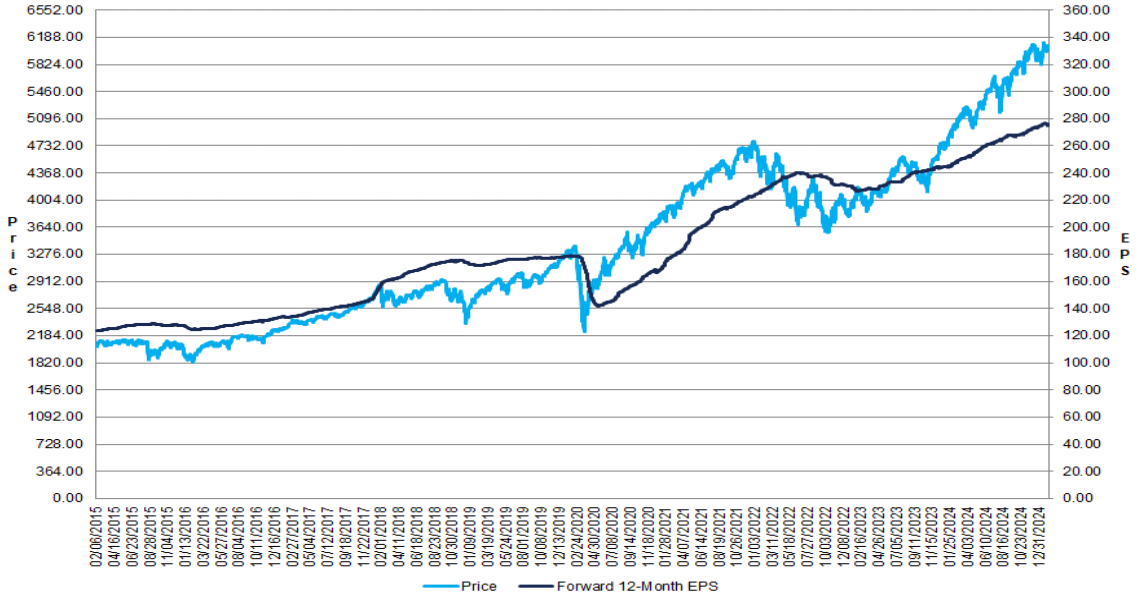
Key takeaway: US earnings continue to grow but the gap between valuation and earnings has increased.
US Bond Rollercoaster
One of the most difficult directional views since the pandemic has been US bonds as well as sovereign bonds in general. During the past four calendar years (2021-2024), US Treasuries have delivered very little return (cumulative return of -10%3), and very little diversification, with correlations to equities shifting positive. In 2024, US 10-year Treasury yields ranged from 3.6% to 4.7%, with at least two V-shaped cycles over the year.
The below chart illustrates our tactical bond signal which is meant to complement the longer-term carry and term premium. It has reflected the bond rollercoaster and importantly its various turning points.
Monthly Bond Macro Signal Attribution by Concept January 2018 – December 2024
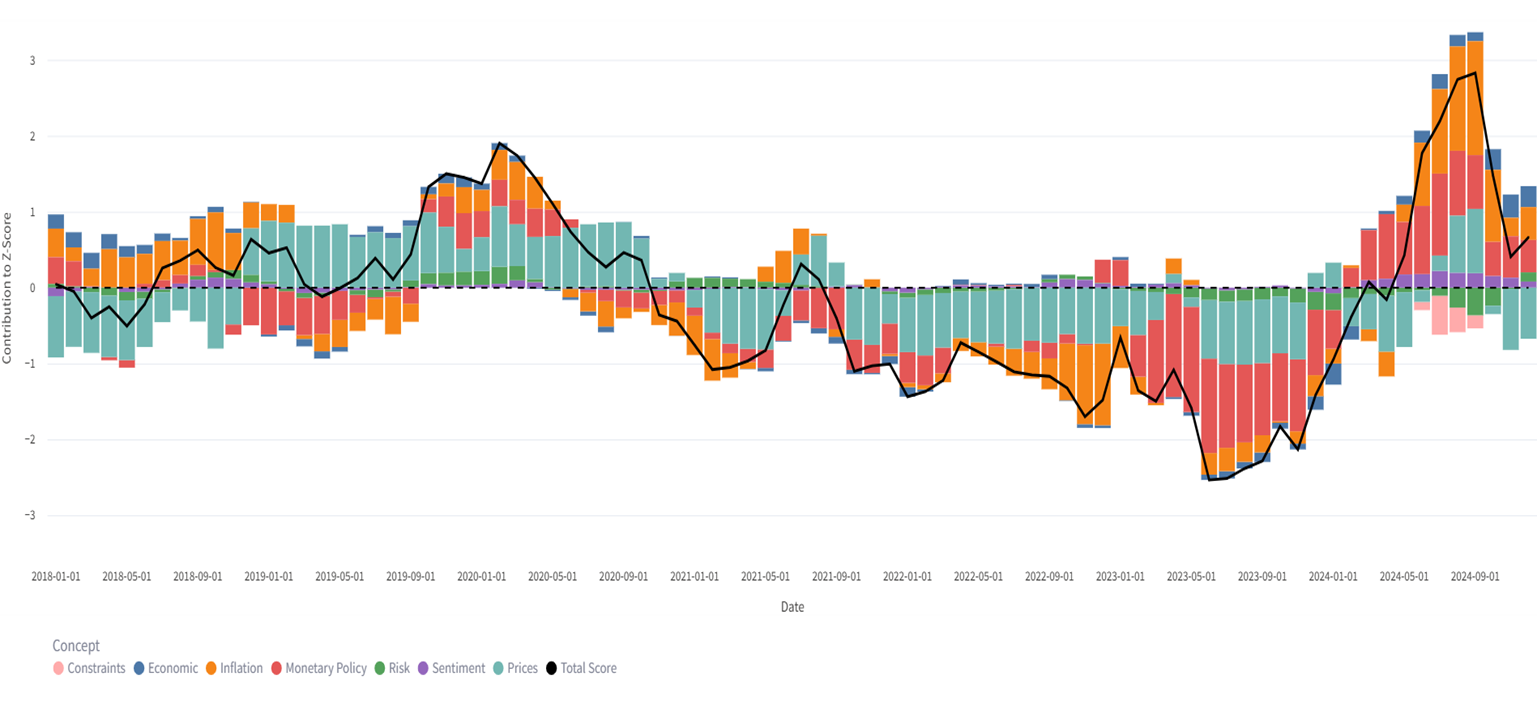
Key takeaway: Net long or short bond positions require relative nimbleness in mind as well as exposure.
US Economic Cycle
Prior to the active stimulus to combat the effects of the Covid lockdowns and large-scale unemployment, the US economic cycle was relatively well behaved for ten years. Given the aggressive policy intervention and very high fiscal stimulus deployed, the US has experienced four phases of the economic cycle in a very short four years.
The below illustrates this journey based on our proprietary leading economic indicators (LEIs) and coincident economic indicators (CEIs). Currently, the US economy is in neither contraction nor recovery, in other words the “no landing” scenario. There is still room for the US economy to expand if the new Trump administration can quickly implement its growth initiatives, such as deregulation and budget cuts. Alternatively, the economy could contract if policies that impede growth, such as tariffs and unfunded tax cuts, prevail.
US Flexcasting Indicators
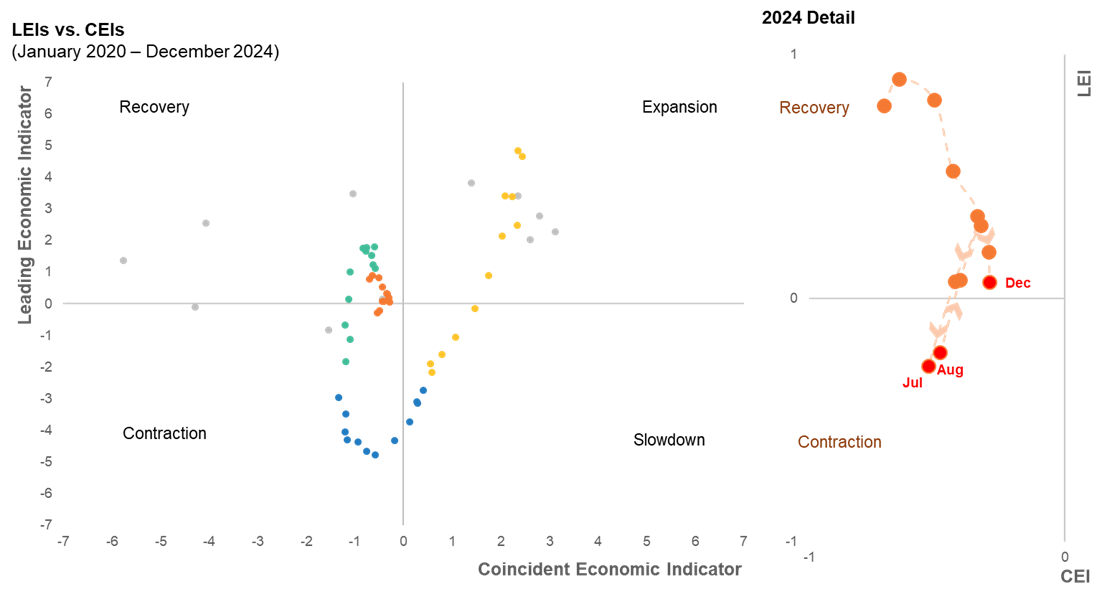
Key takeaway: As of yet, the “no landing” scenario for the US economy is most likely; consequently, it could expand into a recovery or descend into a contraction. No bets are off.
1 Source: Federal Reserve Bank of Cleveland https://www.clevelandfed.org/indicators-and-data/inflation-nowcasting, accessed on 14 Jan 2025.
2 Source: Factset https://www.factset.com/earningsinsight, as of January 10, 2025.
3 Source: JPMorgan US Treasury Index.
Authors

Newton multi-asset solutions team
Insights from the Newton multi-asset solutions team
PAST PERFORMANCE IS NOT NECESSARILY INDICATIVE OF FUTURE RESULTS. Any reference to a specific security, country or sector should not be construed as a recommendation to buy or sell this security, country or sector. Please note that strategy holdings and positioning are subject to change without notice. MAR007072. Exp 2/30. For additional Important Information, click on the link below.
Important information
For Institutional Clients Only. Issued by Newton Investment Management North America LLC ("NIMNA" or the "Firm"). NIMNA is a registered investment adviser with the US Securities and Exchange Commission ("SEC") and subsidiary of The Bank of New York Mellon Corporation ("BNY"). The Firm was established in 2021, comprised of equity and multi-asset teams from an affiliate, Mellon Investments Corporation. The Firm is part of the group of affiliated companies that individually or collectively provide investment advisory services under the brand "Newton" or "Newton Investment Management". Newton currently includes NIMNA and Newton Investment Management Ltd ("NIM") and Newton Investment Management Japan Limited ("NIMJ").
Material in this publication is for general information only. The opinions expressed in this document are those of Newton and should not be construed as investment advice or recommendations for any purchase or sale of any specific security or commodity. Certain information contained herein is based on outside sources believed to be reliable, but its accuracy is not guaranteed.
Statements are current as of the date of the material only. Any forward-looking statements speak only as of the date they are made, and are subject to numerous assumptions, risks, and uncertainties, which change over time. Actual results could differ materially from those anticipated in forward-looking statements. No investment strategy or risk management technique can guarantee returns or eliminate risk in any market environment and past performance is no indication of future performance.
Information about the indices shown here is provided to allow for comparison of the performance of the strategy to that of certain well-known and widely recognized indices. There is no representation that such index is an appropriate benchmark for such comparison.
This material (or any portion thereof) may not be copied or distributed without Newton’s prior written approval.
In Canada, NIMNA is availing itself of the International Adviser Exemption (IAE) in the following Provinces: Alberta, British Columbia, Manitoba and Ontario and the foreign commodity trading advisor exemption in Ontario. The IAE is in compliance with National Instrument 31-103, Registration Requirements, Exemptions and Ongoing Registrant Obligations.


